hub: One Page for My Whole Homelab
| Date | 11/19/2026 |
| Tags | Homelab Next.js |
Too many tabs
My homelab grew the way they all do. A server for Jellyfin, a Pi running Pi-hole, a droplet for a few web apps, a budgeting app, a bookmark manager, a local LLM, a tiny Kubernetes cluster to learn on. Every one of those has its own admin page, and none of them tell me anything unless I go and look.
So at the end of October I started building hub: one page I can open in the morning that answers "is anything wrong?" first, and then shows everything else I care about at a glance. Servers, drives, the network, containers, the weather, what's due for school, the front door camera. Three weeks and 166 commits later it has 29 integrations, 18 pages and 51 alert rules, and it's the first tab I open every day.
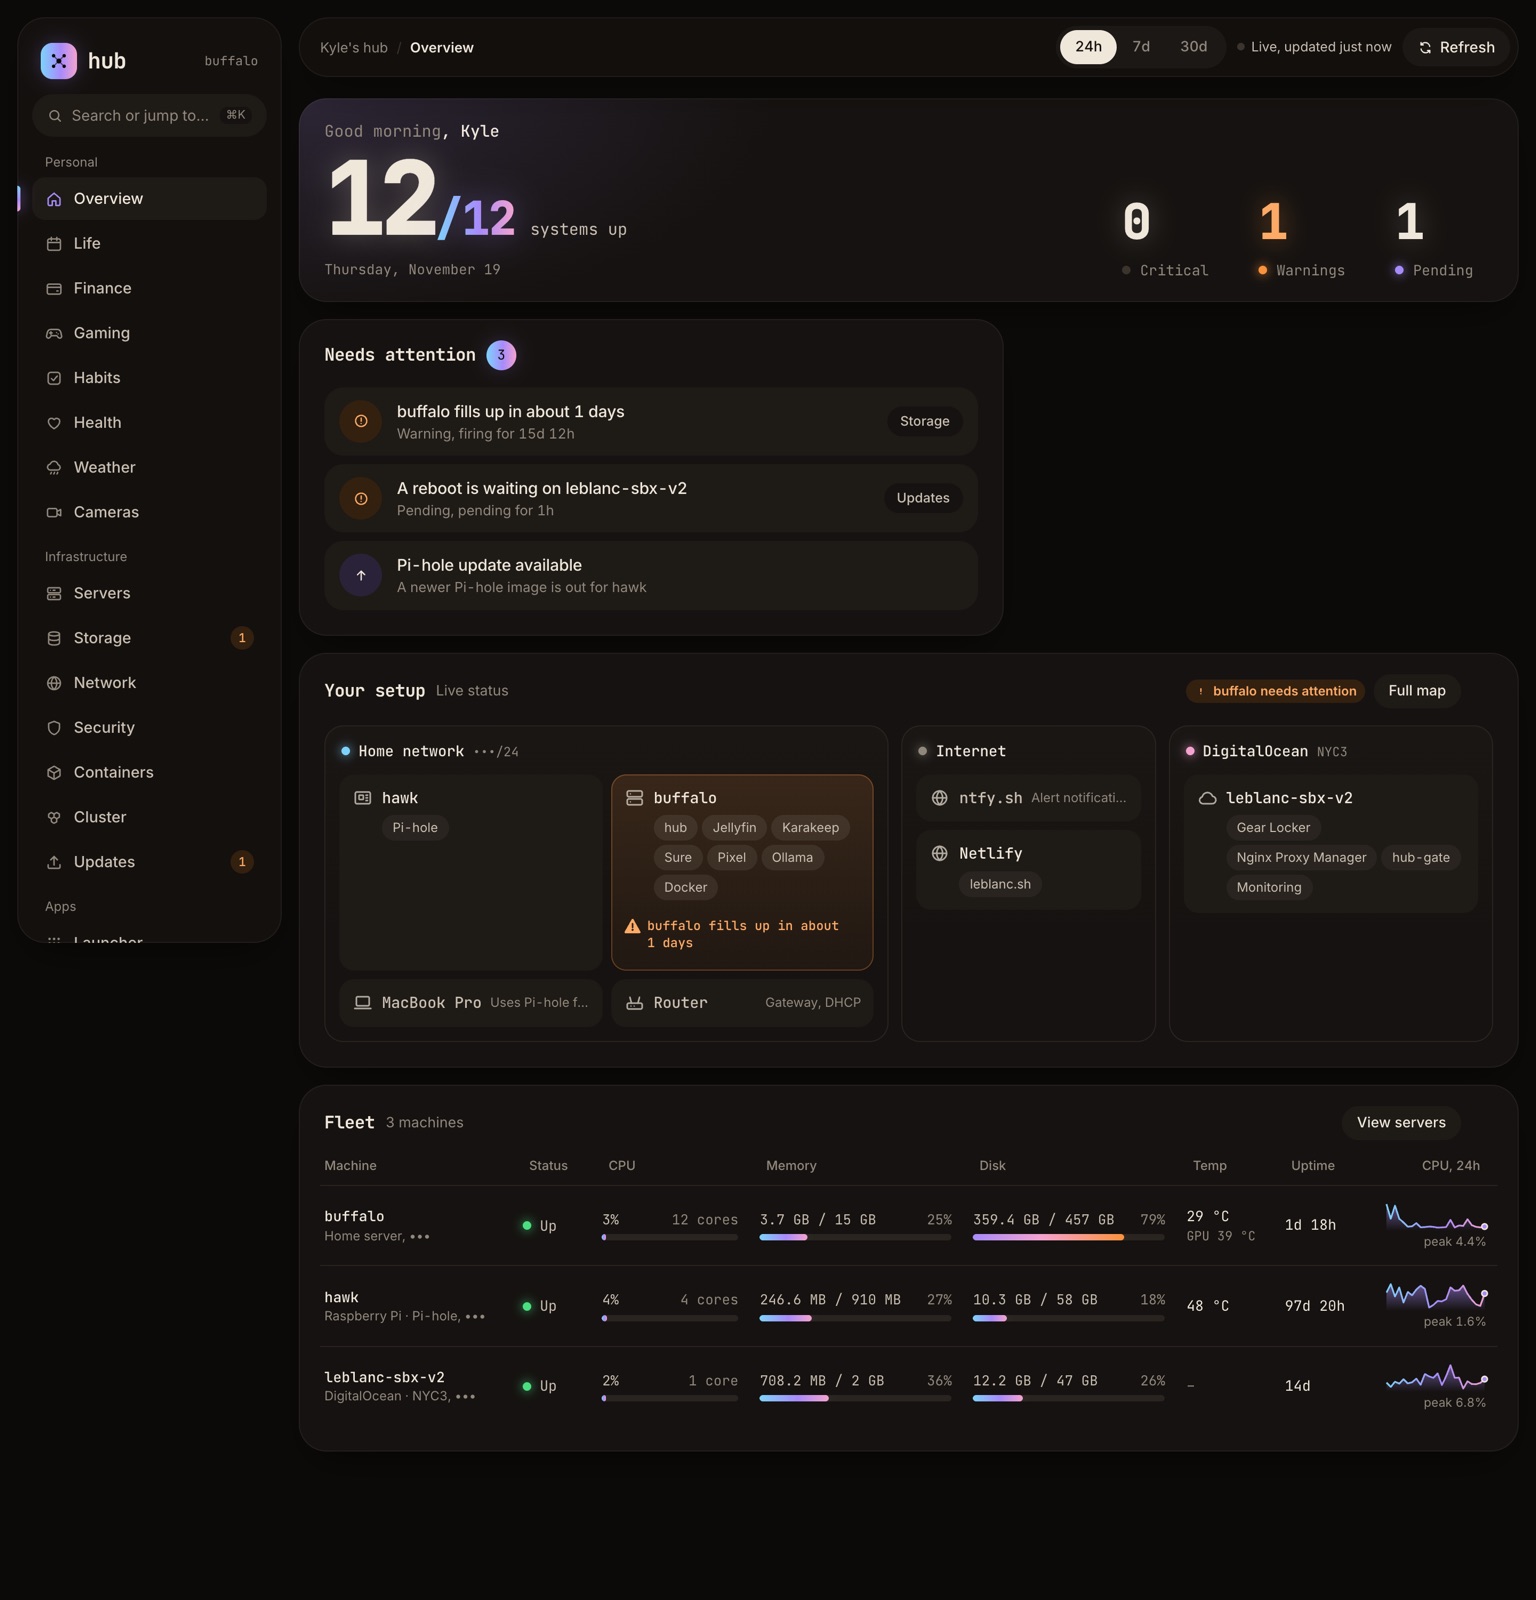
The Overview. The big number is how many things are up. Bright colour is saved for problems.
Quiet unless something is wrong
The main rule I gave myself: healthy things don't get badges or colour. If everything is fine the page is calm and mostly grey. If a drive is filling up or a container is down, it gets a badge on its card and a line in "Needs attention" at the top, with words next to the colour so it's never just a red dot. It sounds obvious, but most dashboards I've used light up green everywhere, and then the one red thing gets lost.
The other rule is that hub records its own history. Every card runs in the background once a minute, even with no browser open, and the numbers go into SQLite. That's where the uptime bars, the speed test chart and the "fills up in about 5 days" predictions come from. No Prometheus server, no Grafana, just one file that gets backed up every night.
How it works
hub is a Next.js 16 app in a pnpm monorepo. Every integration is its own small package with two halves: a server half that fetches the data, holds the secrets and reports metrics, and a client half with the cards that show it. The two are separate exports, so API keys never end up in the browser.
The pages, cards and alert rules all come from one YAML file, and editing it reloads hub live with no restart. Adding my new media drive from the last post to the dashboard was a one-line change, and the rule under it is the one that's been warning me about media2:
pages:
  - id: storage
    sections:
      - widgets:
          - id: storage-media
            type: host.storage
            title: Media library
            options: { view: folders, paths: [/srv/media, /srv/media2, /srv/media3] }

alerts:
  rules:
    - id: disk-filling
      widget: storage-buffalo
      metric: days_to_full
      below: 30
      for: 1h
      title: "buffalo fills up in about {value} days"
Rules read the recorded history, so "below 30 for 1h" means the prediction has to hold for an hour before my phone buzzes. Alerts go to ntfy and a Discord channel, and they're sent off my network on purpose, so I still hear about it when the whole house is down. hub also pings healthchecks.io every minute, so if hub itself dies, something outside notices.
Where it runs
Everything lives on buffalo, an old Ryzen desktop with a GTX 1650 that does Jellyfin transcoding and runs the local LLM. hawk, a Raspberry Pi 3, handles DNS for the house. The droplet on DigitalOcean is the only thing with a public face.
hub itself has no login. At home I open it directly. From anywhere else I go to hub.leblanc.sh, which lands on a small gate on the droplet that wants a Google sign-in with my account, and only then gets passed over Tailscale to buffalo. None of the admin ports are open to the internet. They only listen on the tailnet.
The little helper containers that read drive health, measure folder sizes and run the nightly backup are locked down hard: no network, read-only file systems, and only the permissions they need. They write their numbers to a shared folder and hub reads them from there.
A few of the pages
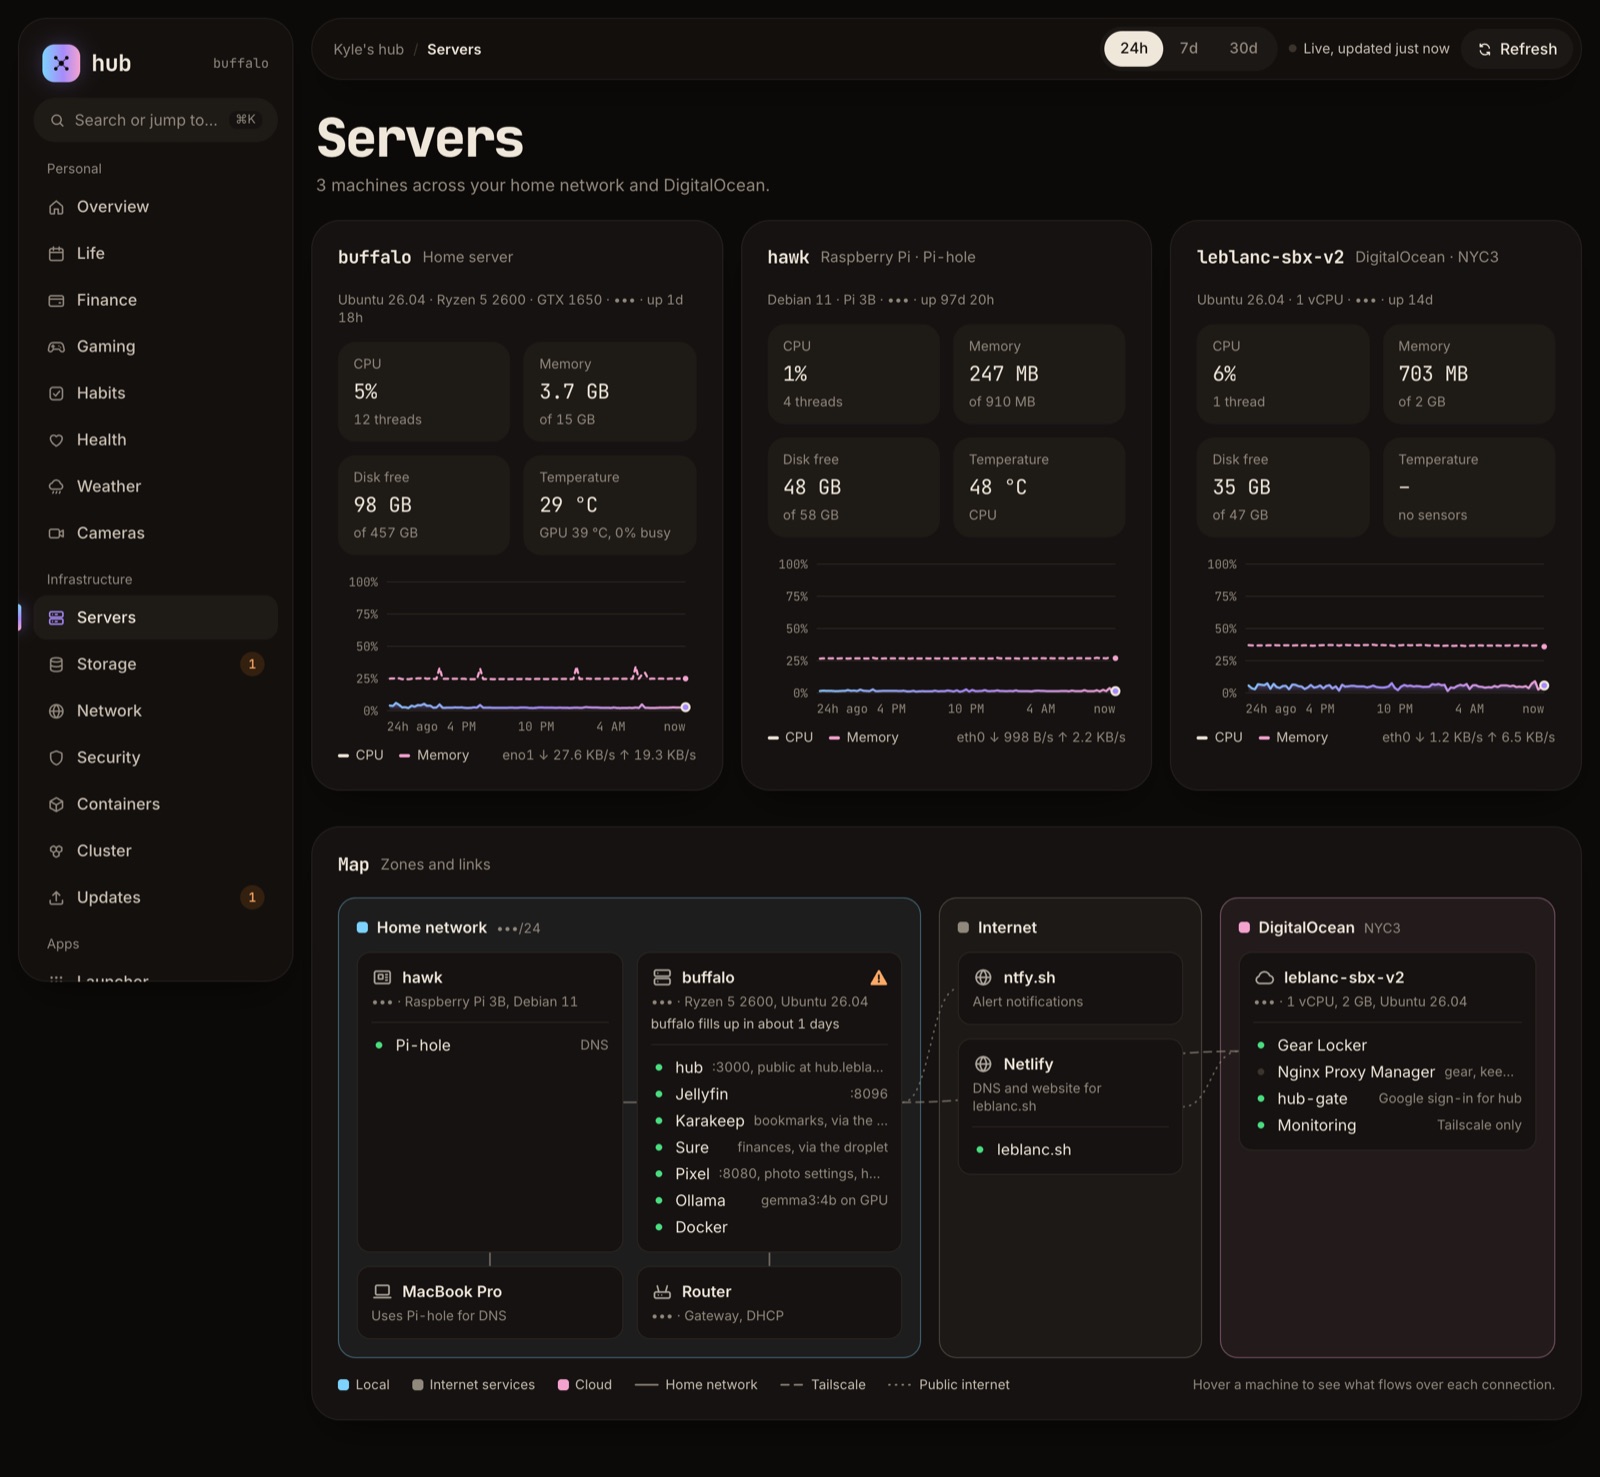
Servers, with a map of what runs where. Hovering a machine shows what flows over each link.
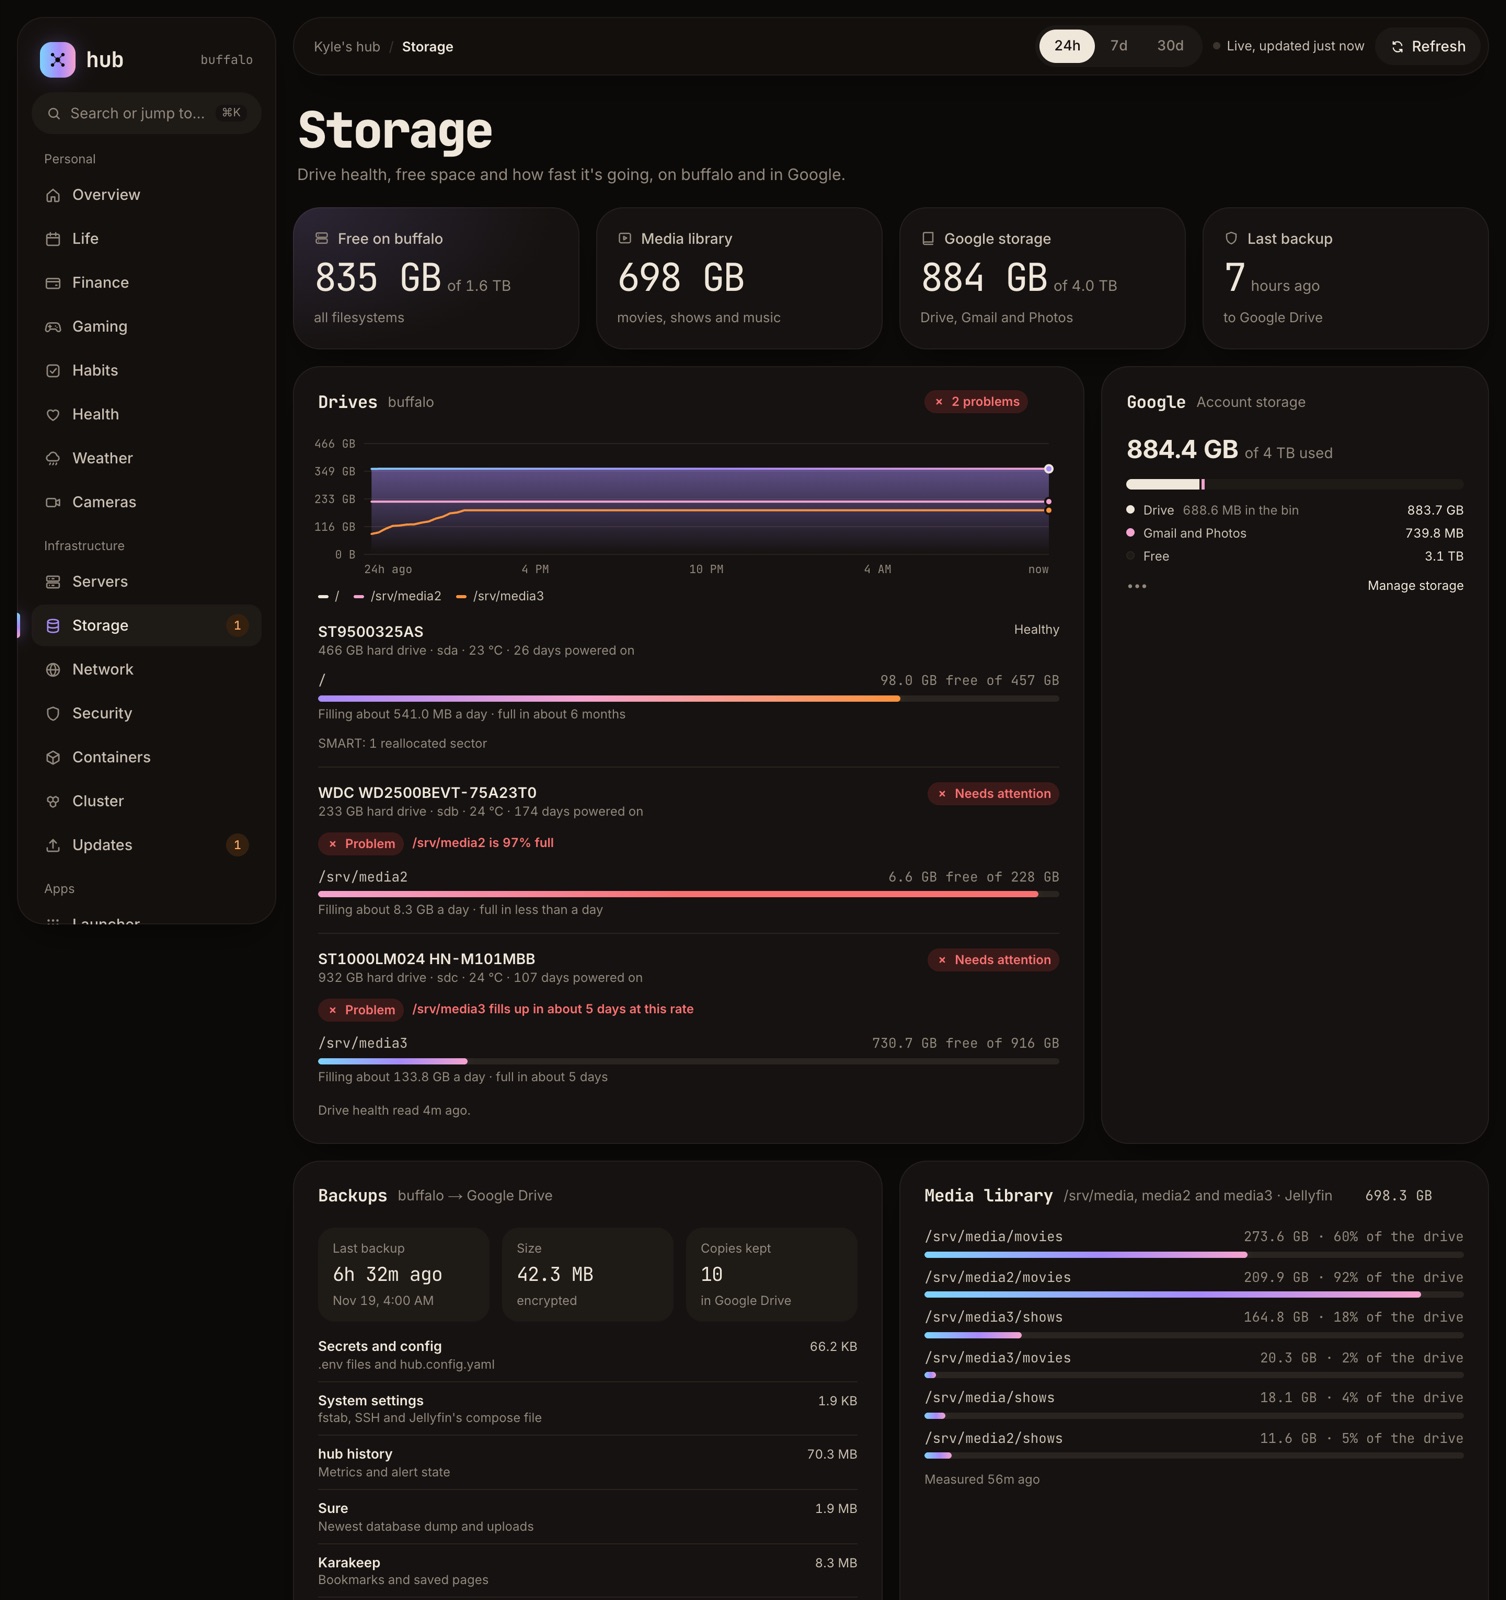
Storage. SMART health, free space and how fast each drive is filling. This is the card that's been yelling at me about media2 lately, and it's right.
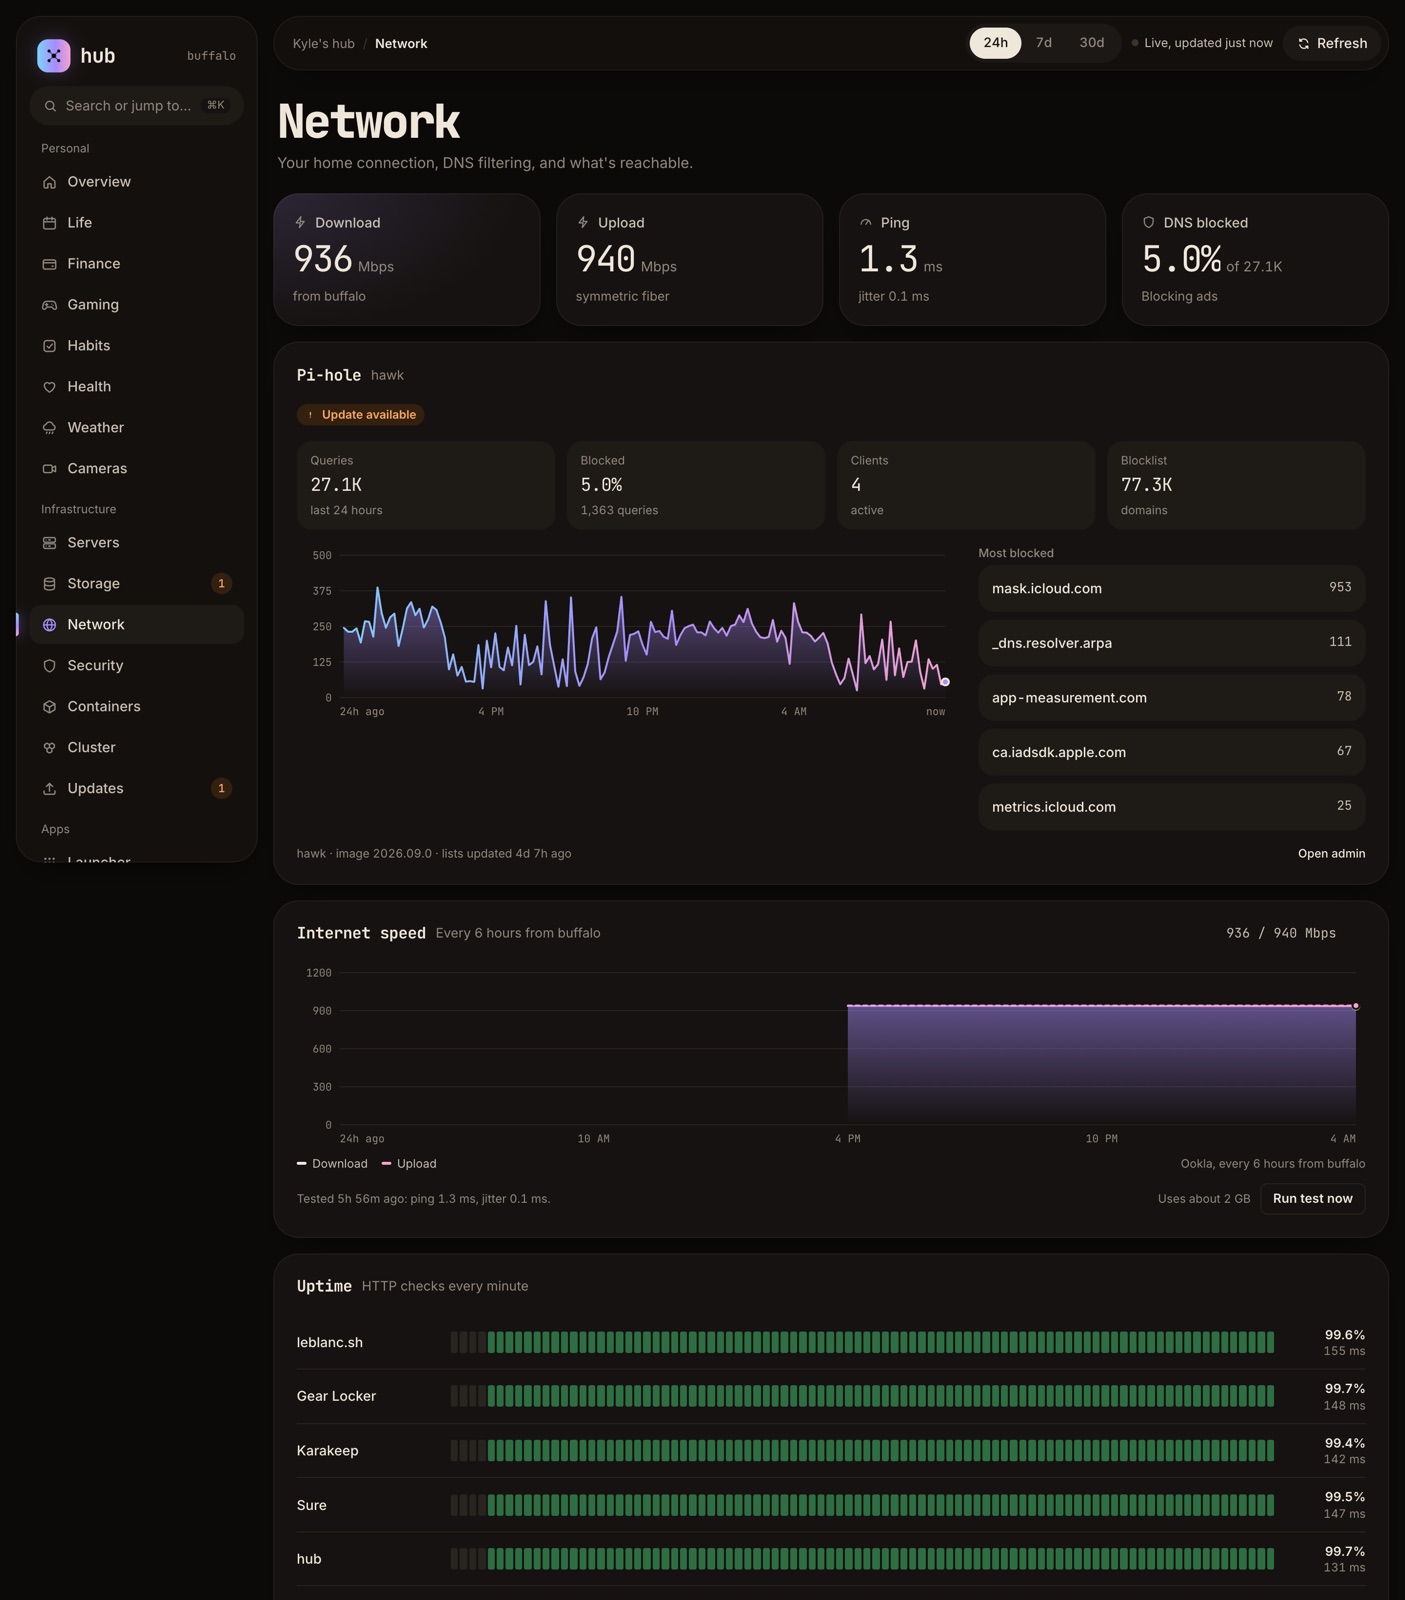
Network. Speed tests run from buffalo every 6 hours, so they measure the house rather than whatever Wi-Fi my laptop is on. The uptime bars are one HTTP check a minute per service.
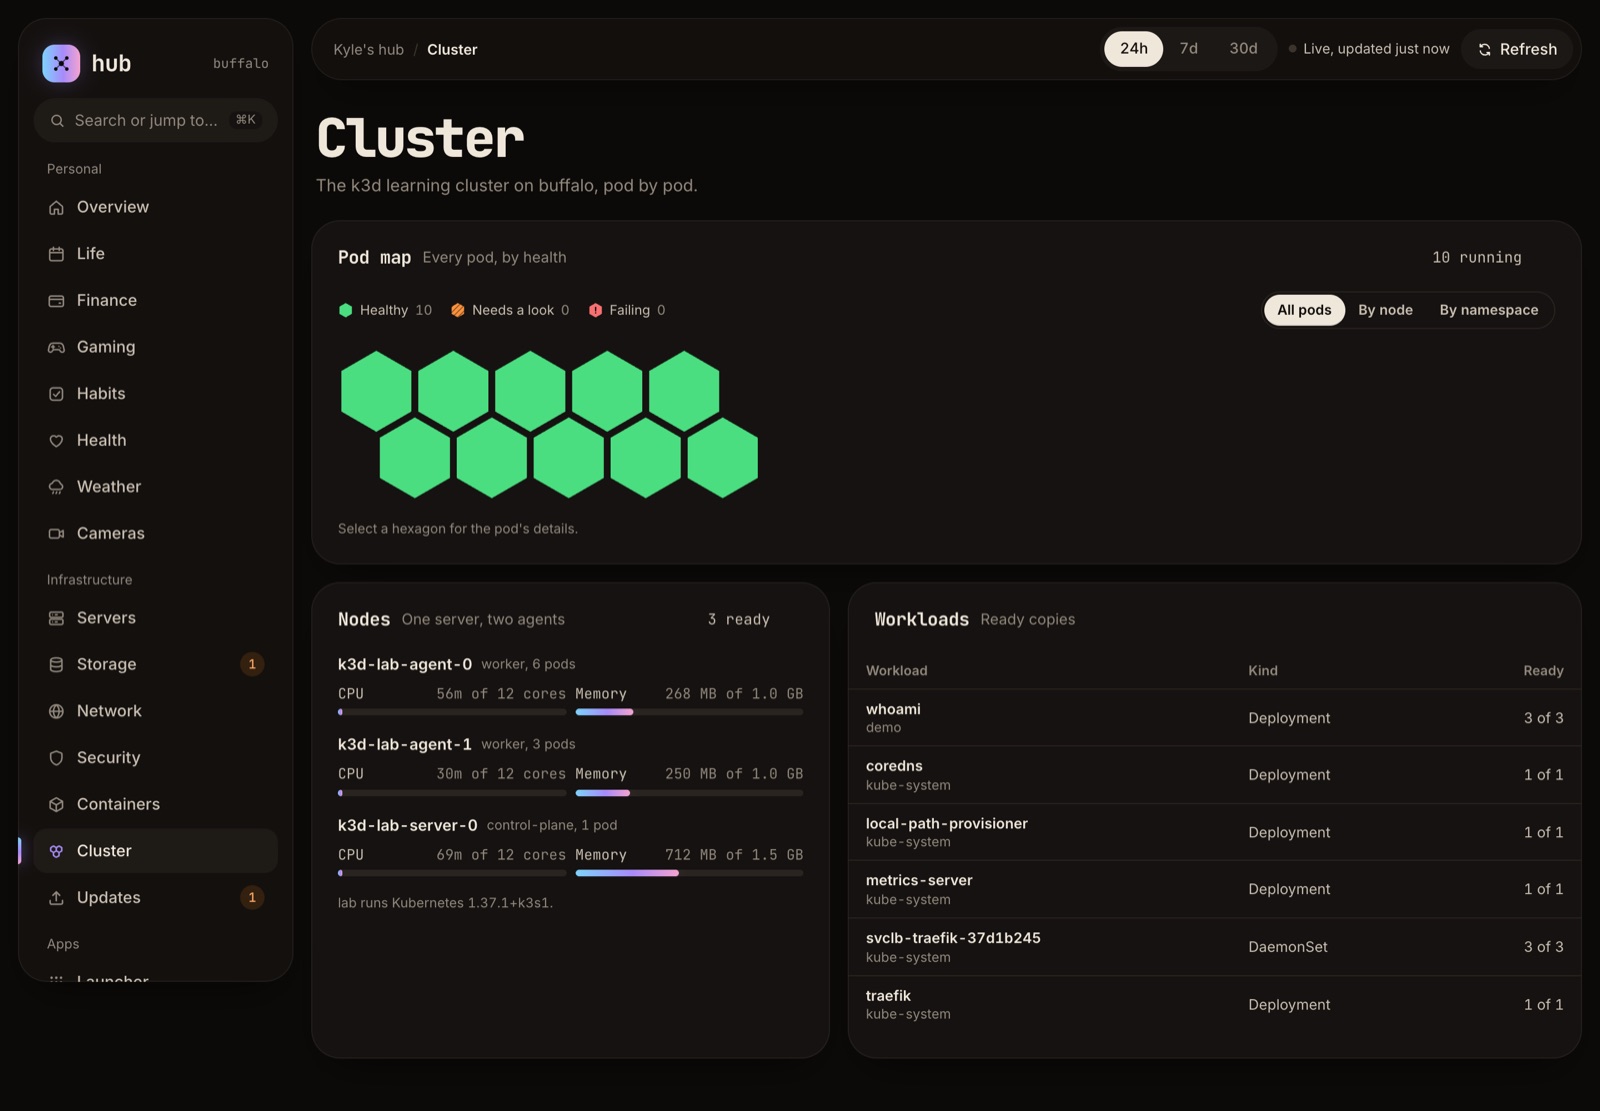
The k3d learning cluster. Every pod is a hexagon coloured by health, and selecting one shows its details.
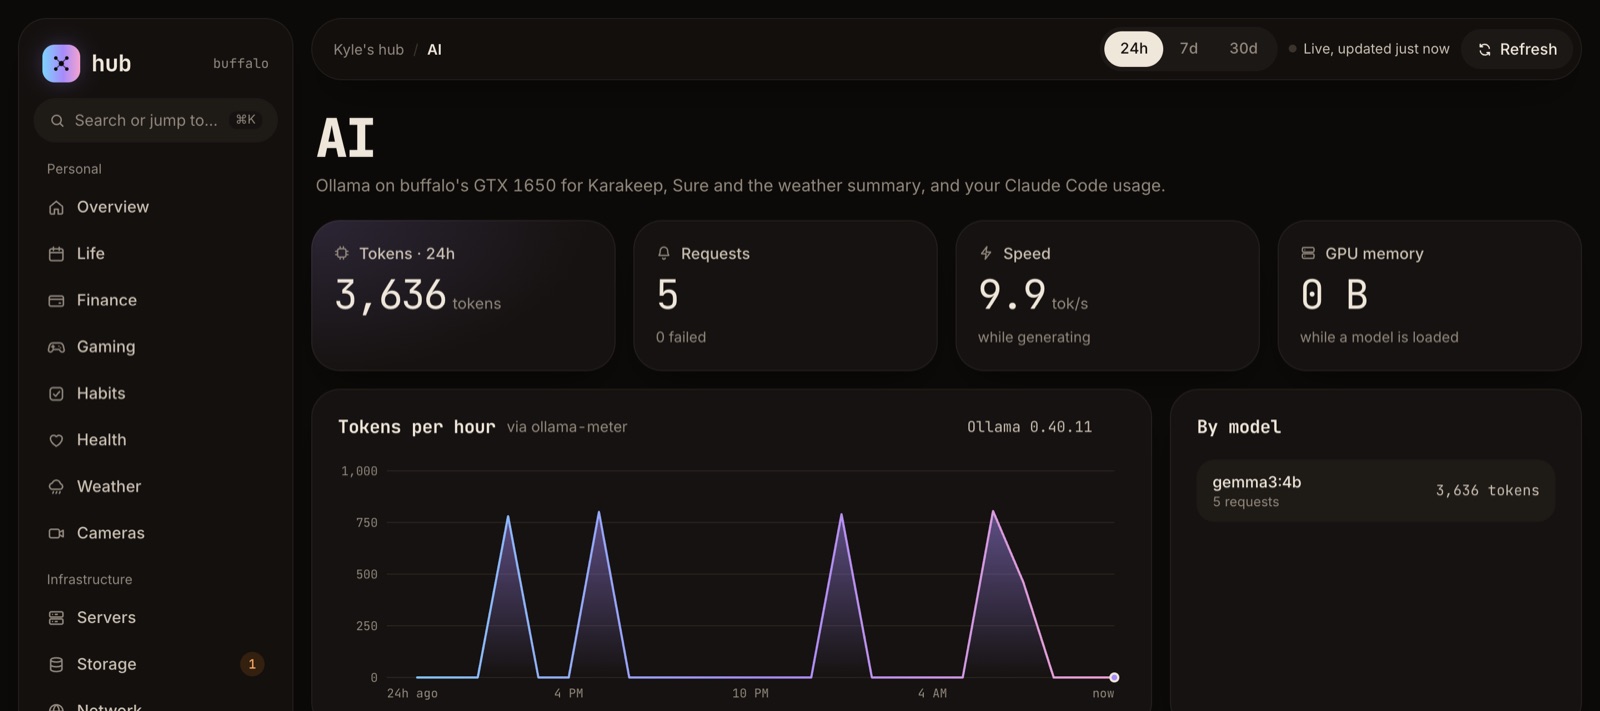
Local AI. Ollama on the GTX 1650 summarises the weather forecast discussion and writes a morning briefing that lands in Discord at 7 AM. Not fast, but free and private. Further down the same page (not in the screenshot) is my Claude Code usage. Claude Code can send OpenTelemetry metrics to any endpoint, so mine reports to hub every minute while it works, and hub keeps daily totals: tokens, estimated cost at API prices, sessions, lines changed and commits.
There are personal pages too: calendar, coursework, finances, health, the doorbell and the bird feeder. Those are my data, so no screenshots of them.
What's next
- A card that lists every device on my LAN. My Fidium router has no API, so it'll be a small scanner on buffalo.
- A "what changed since you last looked" section on the Overview.
- A weekly review posted to Discord every Sunday.
- Moving one real service into the k3d cluster, so it's more than a demo.
The repo is private for now, since it's wired so tightly to my own setup. If any of this is useful to you, send me an email.